Cell maps are intended as tools for reviewing spreadsheets. If you spot an error or an inconsistency in the cell map this should be recorded and, if practicable, corrected.
The cell mapping software provides a method for recording a reviewer's comments. All comments are linked to a specific map (or data table), The comments for a workbook under review are collated in a single worksheet.
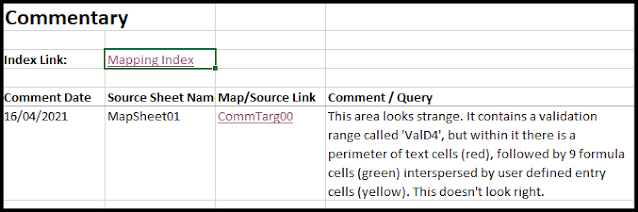 |
| In this case, there's just one comment. |
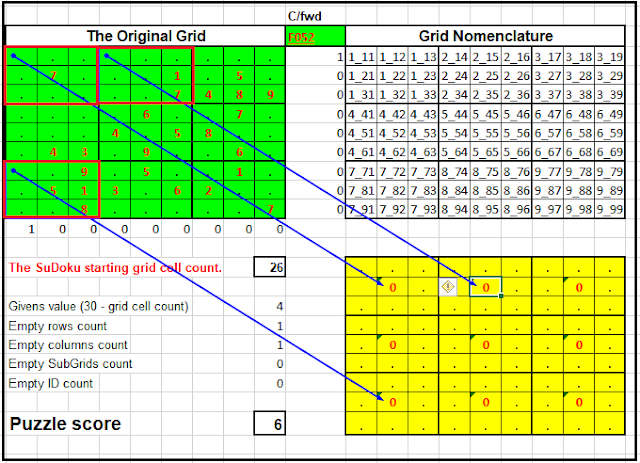
The comment above refers to the area highlighted towards the bottom of the map below and are hyperlinked.to the specific area of the map through the column headed 'Map/Source Link'.
The top left cell the source range provides a link back to the 'Comments. worksheet'. The yellow cells suggest that users should be entering information for collection by a formula, but which one.
At the this point I went back to the orginal worksheet and traced the dependents for some of these 'so called' user entry cells - also coloured yellow as it happens.
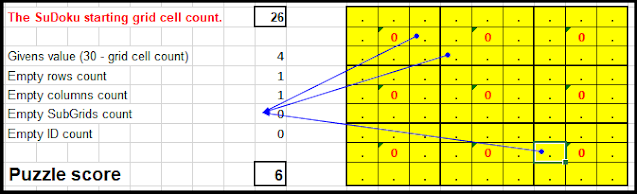 |
| The empty cells all fed the 'EmptySubGids count' |
Each of these cells contained a full point, but, from the perspective of the counting formula to which they pointed, they were empty.
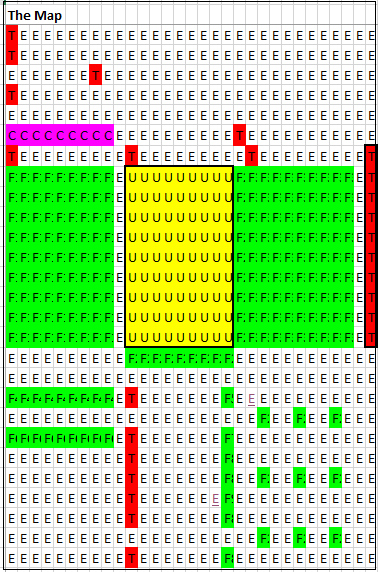
I reversed the analysis and identified how the 'Empty SubGrids count' was calculated - in effect looking at its precedents.
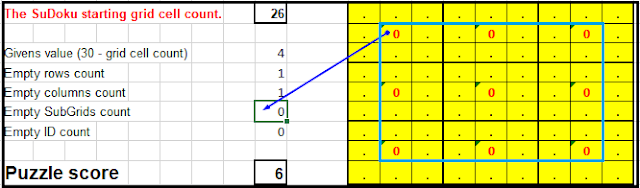 |
| The precedents included the empty cells as well as the formula cells. |
It looked as though I had been a little lazy in deriving the formula for the 'Empty SubGrid count'.
But this did not resolved all the strangeness of the region identified in my original query. Why was there an outer frame of text cells (the red ones) and did they all need to be validated?
Dead end Pathways
When building a spreadsheet (or, in this case, a significant revision to a spreadsheet), one usually has a good idea of what the result should look like, but not necessarily the methodology for getting there.
I recall rebuilding the original entry grid via copy and paste. Inevitably, this carried all the associated entry validation. This shows up in the Names/Validation table.
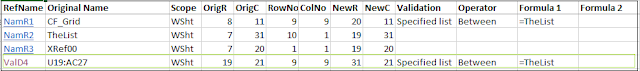 |
| The Named Ranges Table also carries cell validation criteria. |
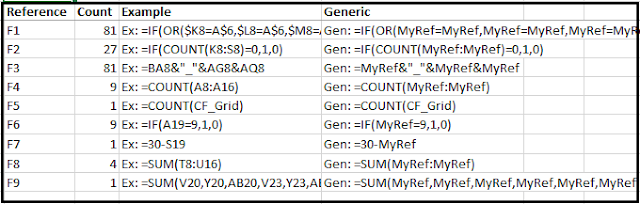
While I changed my mind about how to use the copied grid, it provided a useful guide for copying and pasting the formula that evaluated whether a Sub-Grid was empty.
 |
| Source ranges are framed in red - picture edited! |
Note that each cell that carries a formula is at the centre of its own sub-grid, accordingly the required formula references matched exactly. This made it much easier to copy and paste the formulae correctly, but it is open to debate whether it is the right approach from a programmer's perspective.
Making the Changes
At this juncture I had two problems that were still unresolved, even though I had a good idea how to make the changes.
Going back to original spreadsheet, I made the following changes
- The validation criteria for the range U19:AC27 were removed.
- The full points in the cells of the SuDoku puzzle frame that did not contain a formula were deleted.
- For evaluating the Empty SubGrids count, I pointed to each cell that contained a formula rather than the global range that contained the formulae.
This changed the look of the worksheet, but the results of the formulae look identical. Indeed, they are supposed to be the same albeit the the formula for the Empty SubGrids count has changed
The revised Cell Map looks significantly different. Note that the red and yellow cells in the bottom right hand corner no longer appear.
 |
| The Revised Cell Map |
Almost, inevitably the changes to the original worksheet also generated changes to the formulae list and the Names/Validation Table.
 |
| Revised Formulae listing |
 |
| Revised Names listing |
All the changes to the original spreadsheet are summarised in the responses to the comments.
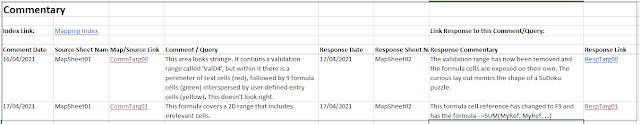 |
| Comments matched to their resonses. |
Revised Mapping Software
The revised software is available at ACBA-Mapping. In addition, although software is intended to be intuitive and self explanatory, it rarely is. I have created a user group at MSExcelCellMapping@groups.io . You are welcome to join and ask questions about the software.
Spreadsheet errors and inconsistensies is a subject that is of concern by professional developers as well as amateurs. The European Spreadsheet Risk Interest Group (EuSpRIG) considers the problems from an academic and professional perspective. The following links provide access to the
EuSpRIG website and
discussion forum.


Comments
Post a Comment