It is a simplified, colour coded version of an Excel Worksheet.
The map shows the structure of the worksheet, its input cells, constants, primary formula and 'named' ranges. The map is designed for spreadsheet developers who work in isolation (i.e. not part of a team), but who, nevertheless, build complex spreadsheet systems. It highlights oddities and inconsistencies within a spreadsheet structure.
Excel has its own built-in auditing and mapping tools.
These are useful for auditing one formula or one name, but they become overburdened with detail when trying to audit/review a whole worksheet.
The ACBA Mapping [A revised version of the software is now available. Stephen Allen 05 September 2023] utility generates a map of the original spreadsheet and three map keys to aid the interpretation of the detail. For example, I went on strict weight reducing diet last year where I measured the weight/volume of everything I ate or drank. This was managed using a spreadsheet as shown below.
The map shows the structure of the worksheet, its input cells, constants, primary formula and 'named' ranges. The map is designed for spreadsheet developers who work in isolation (i.e. not part of a team), but who, nevertheless, build complex spreadsheet systems. It highlights oddities and inconsistencies within a spreadsheet structure.
Excel has its own built-in auditing and mapping tools.
 |
| Excel's name manager and formula auditing tools |
These are useful for auditing one formula or one name, but they become overburdened with detail when trying to audit/review a whole worksheet.
The ACBA Mapping [A revised version of the software is now available. Stephen Allen 05 September 2023] utility generates a map of the original spreadsheet and three map keys to aid the interpretation of the detail. For example, I went on strict weight reducing diet last year where I measured the weight/volume of everything I ate or drank. This was managed using a spreadsheet as shown below.
 |
| Each element of each meal was measured separately |
The construction of this spreadsheet took quite a while, but it was not subject to the usual style of review and verification that would have been appropriate within a business or commercial organisation. How could I be sure that I had not made some fundamental errors?
Each cell is annotated by its function within the worksheet. For ease of viewing, the cells are colour coded. The colour coding is provided by the Key,


Some cells are additionally enclosed with a thick black outline. This denotes that the cell or range of cells has been named. There is a key to the named ranges,

You will note that the original name from the mapped worksheet has been replaced with a standard name to prevent naming conflicts within the Map Book. Also the mapped location has shifted to take account need to give information about the original worksheet at the beginning of the map. Details of the changes original row to new row and original column to new column are provided in the named ranges table.
Each named range is hyperlinked to its location on the Cell Map. For example the name 'NamR1' (which was called 'DailyTotal' on the mapped original) links to the range as shown below.
This is not positive proof of an error, but it is sufficiently unusual to be worthwhile investigating.
As a general rule spreadsheet users generate names that they can use within formulae. There are only 5 names listed for this worksheet, but one, 'MyFood', does not appear in any of the generic formulae. This also justifies further investigation.
Here is the cell map for the same spreadsheet.
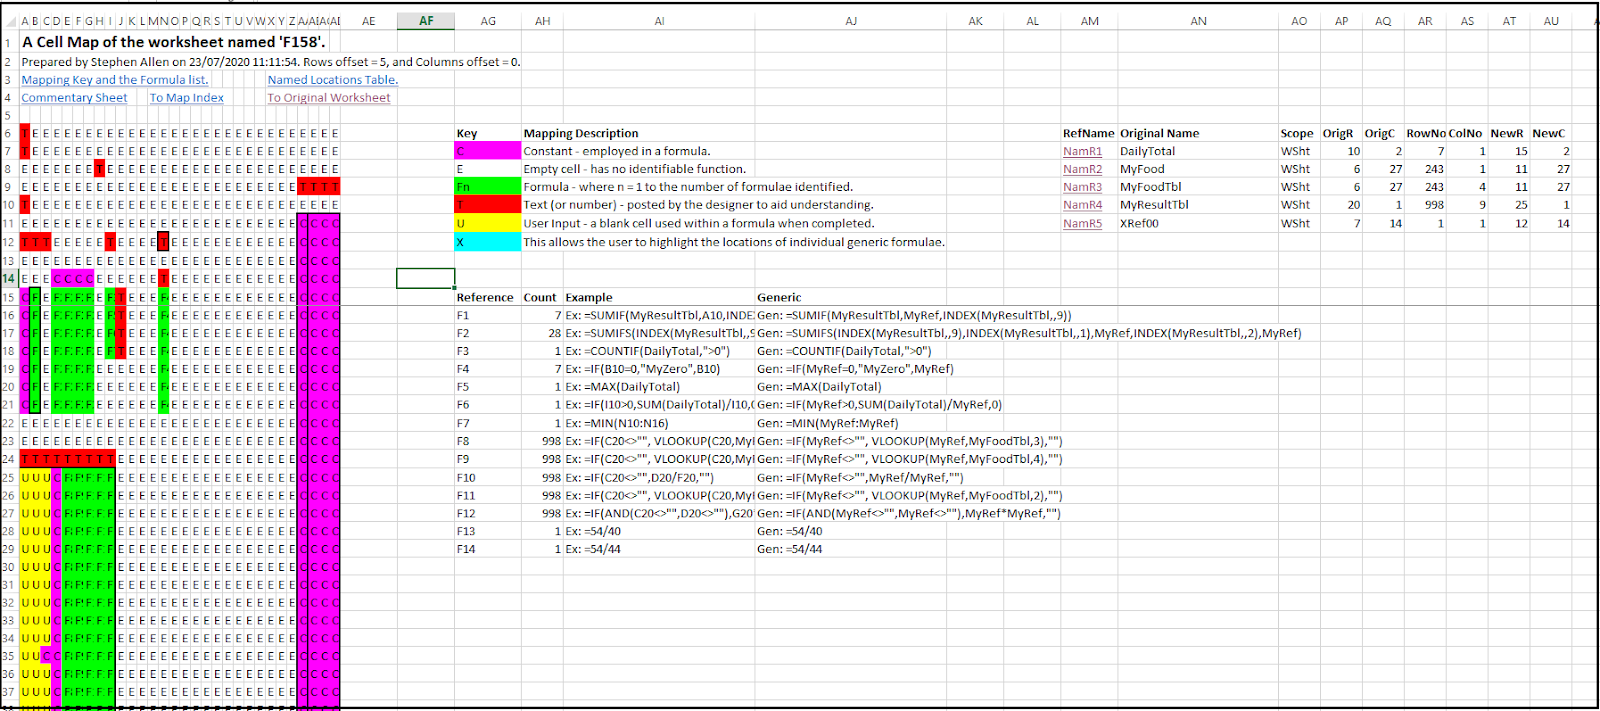 |
| A Cell Map of the Diet Control sheet above |
The Cell Map is the coloured block of cells on the left hand side. The other blocks on the information sheet refer to the explanatory Keys.
The Cell Map
The cell map exposes everything. It also contains a significant amount of detail.
Here is an extract of the above Cell Map showing the detail.
Here is an extract of the above Cell Map showing the detail.
 |
| Cell Map - Detail |

Each formula is analysed by generic type. For this spreadsheet the formulae have been divided into 14 separate types.

The column width of each cell within the cell map does not permit the full formula code to be visible. The sky blue key can be posted with the formula reference. This has the effect of highlighting each map cell that contains that generic formula.
Here the reference 'F2' has been chosen.There are 28 instances of this formula.
 |
| Formula 'F2' highlighted in sky blue. |
Some cells are additionally enclosed with a thick black outline. This denotes that the cell or range of cells has been named. There is a key to the named ranges,

You will note that the original name from the mapped worksheet has been replaced with a standard name to prevent naming conflicts within the Map Book. Also the mapped location has shifted to take account need to give information about the original worksheet at the beginning of the map. Details of the changes original row to new row and original column to new column are provided in the named ranges table.
Each named range is hyperlinked to its location on the Cell Map. For example the name 'NamR1' (which was called 'DailyTotal' on the mapped original) links to the range as shown below.
 |
| Highlighting a named range |
Using the Cell Map
The cell map gives you a compact visual representation of the original spreadsheet. Albeit interesting, the primary purpose of the map is to identify possible errors and improve the functionality of the worksheet.Oddities and possible Errors
A cursory examination of the Cell Map reveals the introduction of a constant in a column where all the entries are posted by the User. |
| Unusual Entries |
As a general rule spreadsheet users generate names that they can use within formulae. There are only 5 names listed for this worksheet, but one, 'MyFood', does not appear in any of the generic formulae. This also justifies further investigation.
Access to the Software
The software package is available, without charge, from the link ACBA Mapping. If you need advice or have any queries please contact me at Stephen Allen.
Spreadsheet errors and inconsistensies is a subject that is of concern by professional developers as well as amateurs. The European Spreadsheet Risk Interest Group (EuSpRIG) considers the problems from an academic and professional perspective. The following links provide access to the EuSpRIG website and discussion forum.
Comments
Post a Comment