Overview
ACBA Mapping software package provides a methodology for
logging the development of a Worksheet (or the whole Workbook) over time. There
are three primary elements to the package – the maps of worksheets, the lists
of worksheet/workbook characteristics and the development commentary/logs. This
detail is held in a separate but connected workbook.
Each of these primary elements will be considered
separately. This article considers the worksheet maps.
Worksheet Maps
ACBA Mapping delivers a view of your spreadsheet from a
different perspective. In this view, colours map the according to the functionality
of each cell. The detail of the cell, its specific formula or current value
remain hidden. This means there is less to distract the reviewer keen to
understand the spreadsheet’s overall structure and approach.
Geographic or road maps have keys and / or legends designed
to illustrate the symbols and their meaning. Similarly, ACBA maps have a key to
the mapping categories and two legends.
The key identifies the meaning of the map’s coloured cells.
The main legend shows where all the formulae of the various
generic types can be found. Each green formula cell is given a reference which identifies
which “generic” formula it contains.
The second legend shows where all the named regions and validated
cells are to be found.
Using the Map
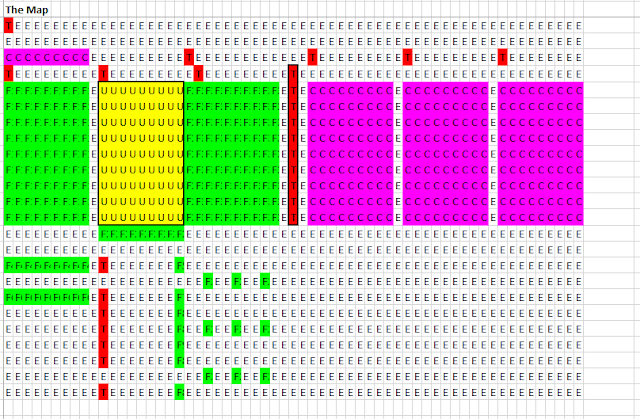
Unlike a real map though, we cannot unfold it and spread it over a large desk (or floor). For a large spreadsheet, and some are very big indeed, you need a way of identifying where a particular formula generic type can be found.
Formulae of a particular generic type can often be found in several locations on a spreadsheet. Accordingly, we have opted for a method that highlights, where these formulae can be found. The map below shows the locations of the generic formula =IF(COUNT(MyRef:MyRef)=0,1,0), which has been given the reference F2. These have been highlighted in turquoise in the map’s detail.
Named regions are identified by thick black borders. They are normally (but not exclusively) found in a single cell or a discrete range of cells. Each member of the names Legend has a hyperlink to the associated map location. Clicking the hyperlink will select the whole range within a black outline. The formula bar will reveal the name value of the range.
Large Spreadsheets
There are times when it is useful to have a view of the whole map. This is especially important for large complex spreadsheets.
When you highlight the Generating the "ACBA-Mapping" Add-Inwhole map region, the VIEW tab provides a ‘Zoom to Selection’ button. This allows a very quick over view of the shape of the spreadsheet. The named regions are helpful for identifying areas of particular importance. Note that the names on each original worksheet have been altered to prevent conflicts, especially when mapping the development of a worksheet over time. The naming legend however always provides a connection back to the original name.
Downloading ACBA Mapping
The
ACBA-Mapping software is distributed as an Excel Add-In and can be downloaded from the link.
Access to Help
There is a discussion group dedicated to providing a forum for help and information - Excel - Cell Mapping. I recommend you join the group.
Alternatively, you can email me directly from the Stephen Allen link within the form.
Acknowledgements
Spreadsheet Risks
Spreadsheet errors and inconsistencies is a subject that is of concern by professional developers as well as amateurs. The European Spreadsheet Risk Interest Group (EuSpRIG) considers the problems from an academic and professional perspective. The following links provide access to the
EuSpRIG website and
discussion forum.


Comments
Post a Comment