ACBA Mapping – Spring 2022 Revision

Nearly all spreadsheet error values are as a result of a problem within a formula, but …

The ACBA Mapping software was made available in its ribbon-based format in December 2021. There had been considerable testing of the technical aspects of the software and its interaction with the ribbon. However, relatively little testing had been undertaken on publicly available spreadsheet collections like the Enron Corpus.

I began reviewing the Enron spreadsheets on a workbook by workbook basis in early spring 2022. The results of that review will be published later. However, it became clear the different authors had very different approaches to the construction of spreadsheets.

In particular, I came across cell constants which were themselves error values. I should emphasise that these were not as a result of formula errors. The original ACBA Mapping software had not taken account of this possibility.

Cell Constant - Error Values

The spreadsheet file “NYMEX Straddles” displays the following worksheet.


The cells containing error values are highlighted. These are not formula cells. In fact there are no formulae on this worksheet.

Under the December 2021 version of ACBA Mapping all the non-empty cells would have presented as ‘T’ with a background of red. Under this revision the error value cells display as ‘r’ – for error – and these have a dark green background.

The ltter 'r' represents a cellerror value.

Similarly, the workbook review of errors has been amended to include the error constants.


 Chart Sheets

For the most part Chart Sheets are visual representation of data from a worksheet. They are the end product or representation of a data analysis. While, we have now included Chart Sheets in the list of sheet like objects, the table will not show any further analyses.
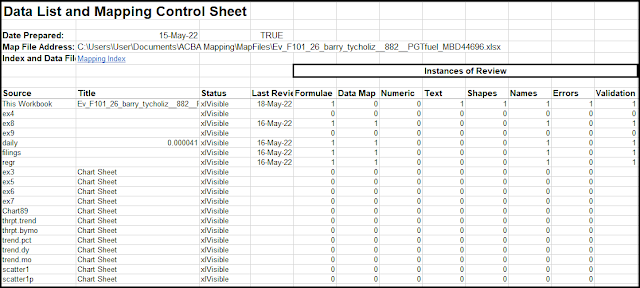
Chart Sheets are included in the list of sheets.

Downloading ACBA Mapping

The ACBA-Mapping software is distributed as an Excel Add-In and can be downloaded from the link.
For those not familiar with handling Excel Add-Ins, instructions on what to expect and where to load your Add-Ins can be found at Generating the "ACBA-Mapping" Add-In.

Access to Help

There is a discussion group dedicated to providing a forum for help and information - Excel - Cell MappingI recommend you join the group.

Alternatively, you can email me directly from the Stephen Allen link within the form.

Acknowledgements

Experts in Excel have offered their advice and I am very grateful for this. My thanks go to Patrick O'Beirne (Systems Modelling), Jan Karel Pieterse (JKP Application Development Services) and Hans Hallebeek (HC & TS).

Spreadsheet Risks

Spreadsheet errors and inconsistencies is a subject that is of concern by professional developers as well as amateurs. The European Spreadsheet Risk Interest Group (EuSpRIG) considers the problems from an academic and professional perspective. The following links provide access to the EuSpRIG website and discussion forum.


Comments

Popular posts from this blog

Cell Maps - Critical Comments

Cell maps are intended as tools for reviewing spreadsheets. If you spot an error or an inconsistency in the cell map this should be recorded and, if practicable, corrected. The cell mapping software provides a method for recording a reviewer's comments. All comments are linked to a specific map (or data table), The comments for a workbook under review are collated in a single worksheet. In this case, there's just one comment. The comment above refers to the area highlighted towards the bottom of the map below and are hyperlinked.to the specific area of the map through the column headed 'Map/Source Link'. The top left cell the source range provides a link back to the 'Comments. worksheet'. The yellow cells suggest that users should be entering information for collection by a formula, but which one.  At the this point I went back to the orginal worksheet and traced the dependents for some of these 'so called' user entry cells - also coloured yellow as it ...

ACBA Mapping: Employing ‘UsedRange’ in Excel

When reviewing a worksheet the ACBA Mapping software uses VBA’s ‘UsedRange’ function to identify the full scope of the sheet. This function is excellent for identifying separate ranges employed in a worksheet, but has some drawbacks. One of these drawbacks has been identified while reviewing the Enron corpus of files ( https://figshare.com/articles/dataset/Enron_Spreadsheets_and_Emails/1221767 ) The Enron corpus of spreadsheets and other correspondence is huge. Felienne Hermans however has whittled the number of workbooks down to 16,189 unique items.   https://www.felienne.com/archives/3634   The workbook that clearly displayed the UsedRange issue is named ‘benjamin_rogers__938__historical outages.xlsx’. Clearly the files have been renamed to prevent duplicates. In this blog though I will refer to it as ‘Historical Outages’. In the original Mapping software, users were advised when the ‘UsedRange’ exceeded half a million cells. This allows the user to escape from the proc...

Big Brother at a Distance

We know that our spreadsheets should be functional and error free, but there is  a tension between how we review a spreadsheet to ensure that it is correct and the functionality of the spreadsheet itself. None of us like Big Brother breathing down our necks too closely. In What is a Cell Map?  I discussed the creation of a simplified version of a spreadsheet to aid review and error trapping. However, the map is itself a spreadsheet. If you created maps for each worksheet in your workbook, the workbook would quickly bloat and become unmanageable. The obvious answer is to post your maps somewhere else, but clearly linked to primary workbook. The ACBA-Mapping package does just that. It generates a separate Map Book to hold all the spreadsheet maps (and other analyses) associated with the parent workbook. The parent workbook has a new worksheet that maintains a summary of all the detailed analyses generated for the workbook. This new worksheet is called 'DataList_and_MappingC...